
Pool metrics, chart data, liquidity data, fees, and estimated values are informational display metrics. They may update over time and can vary based on data availability, pool activity, market conditions, and indexing.
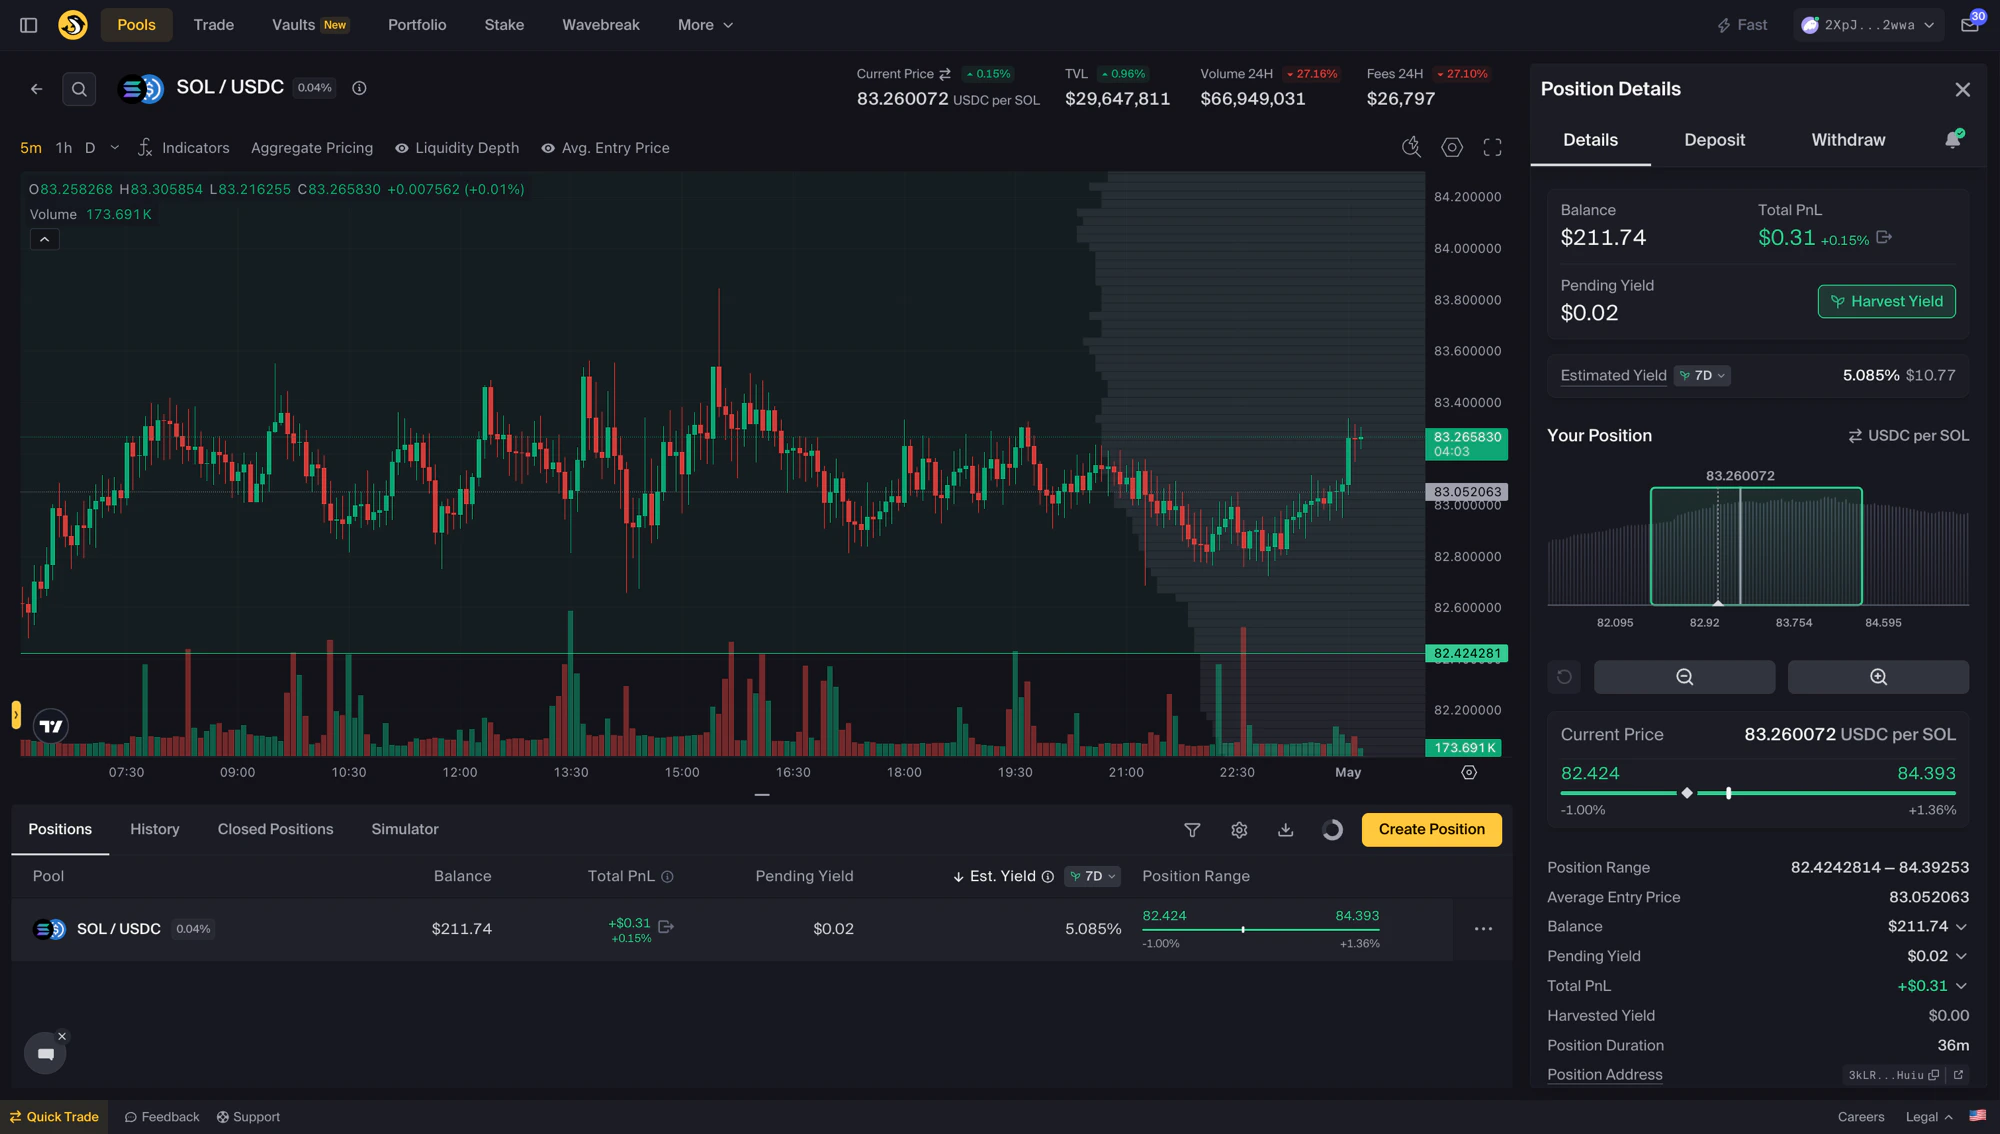
The Liquidity Terminal: pool header stats, chart with overlays, bottom-pane tabs, and the Position Details sidebar
Pool Header
At the top of every Liquidity Terminal, you’ll see four pool stats with 24H deltas:
For Adaptive Fee Pools, the Create Position panel also shows an Adaptive Fees Enabled banner with the current effective rate.
Price Chart
The price chart displays aggregated price history for the selected asset pair. Available controls include:
See the Price Chart Navigation Guide for a detailed walkthrough.
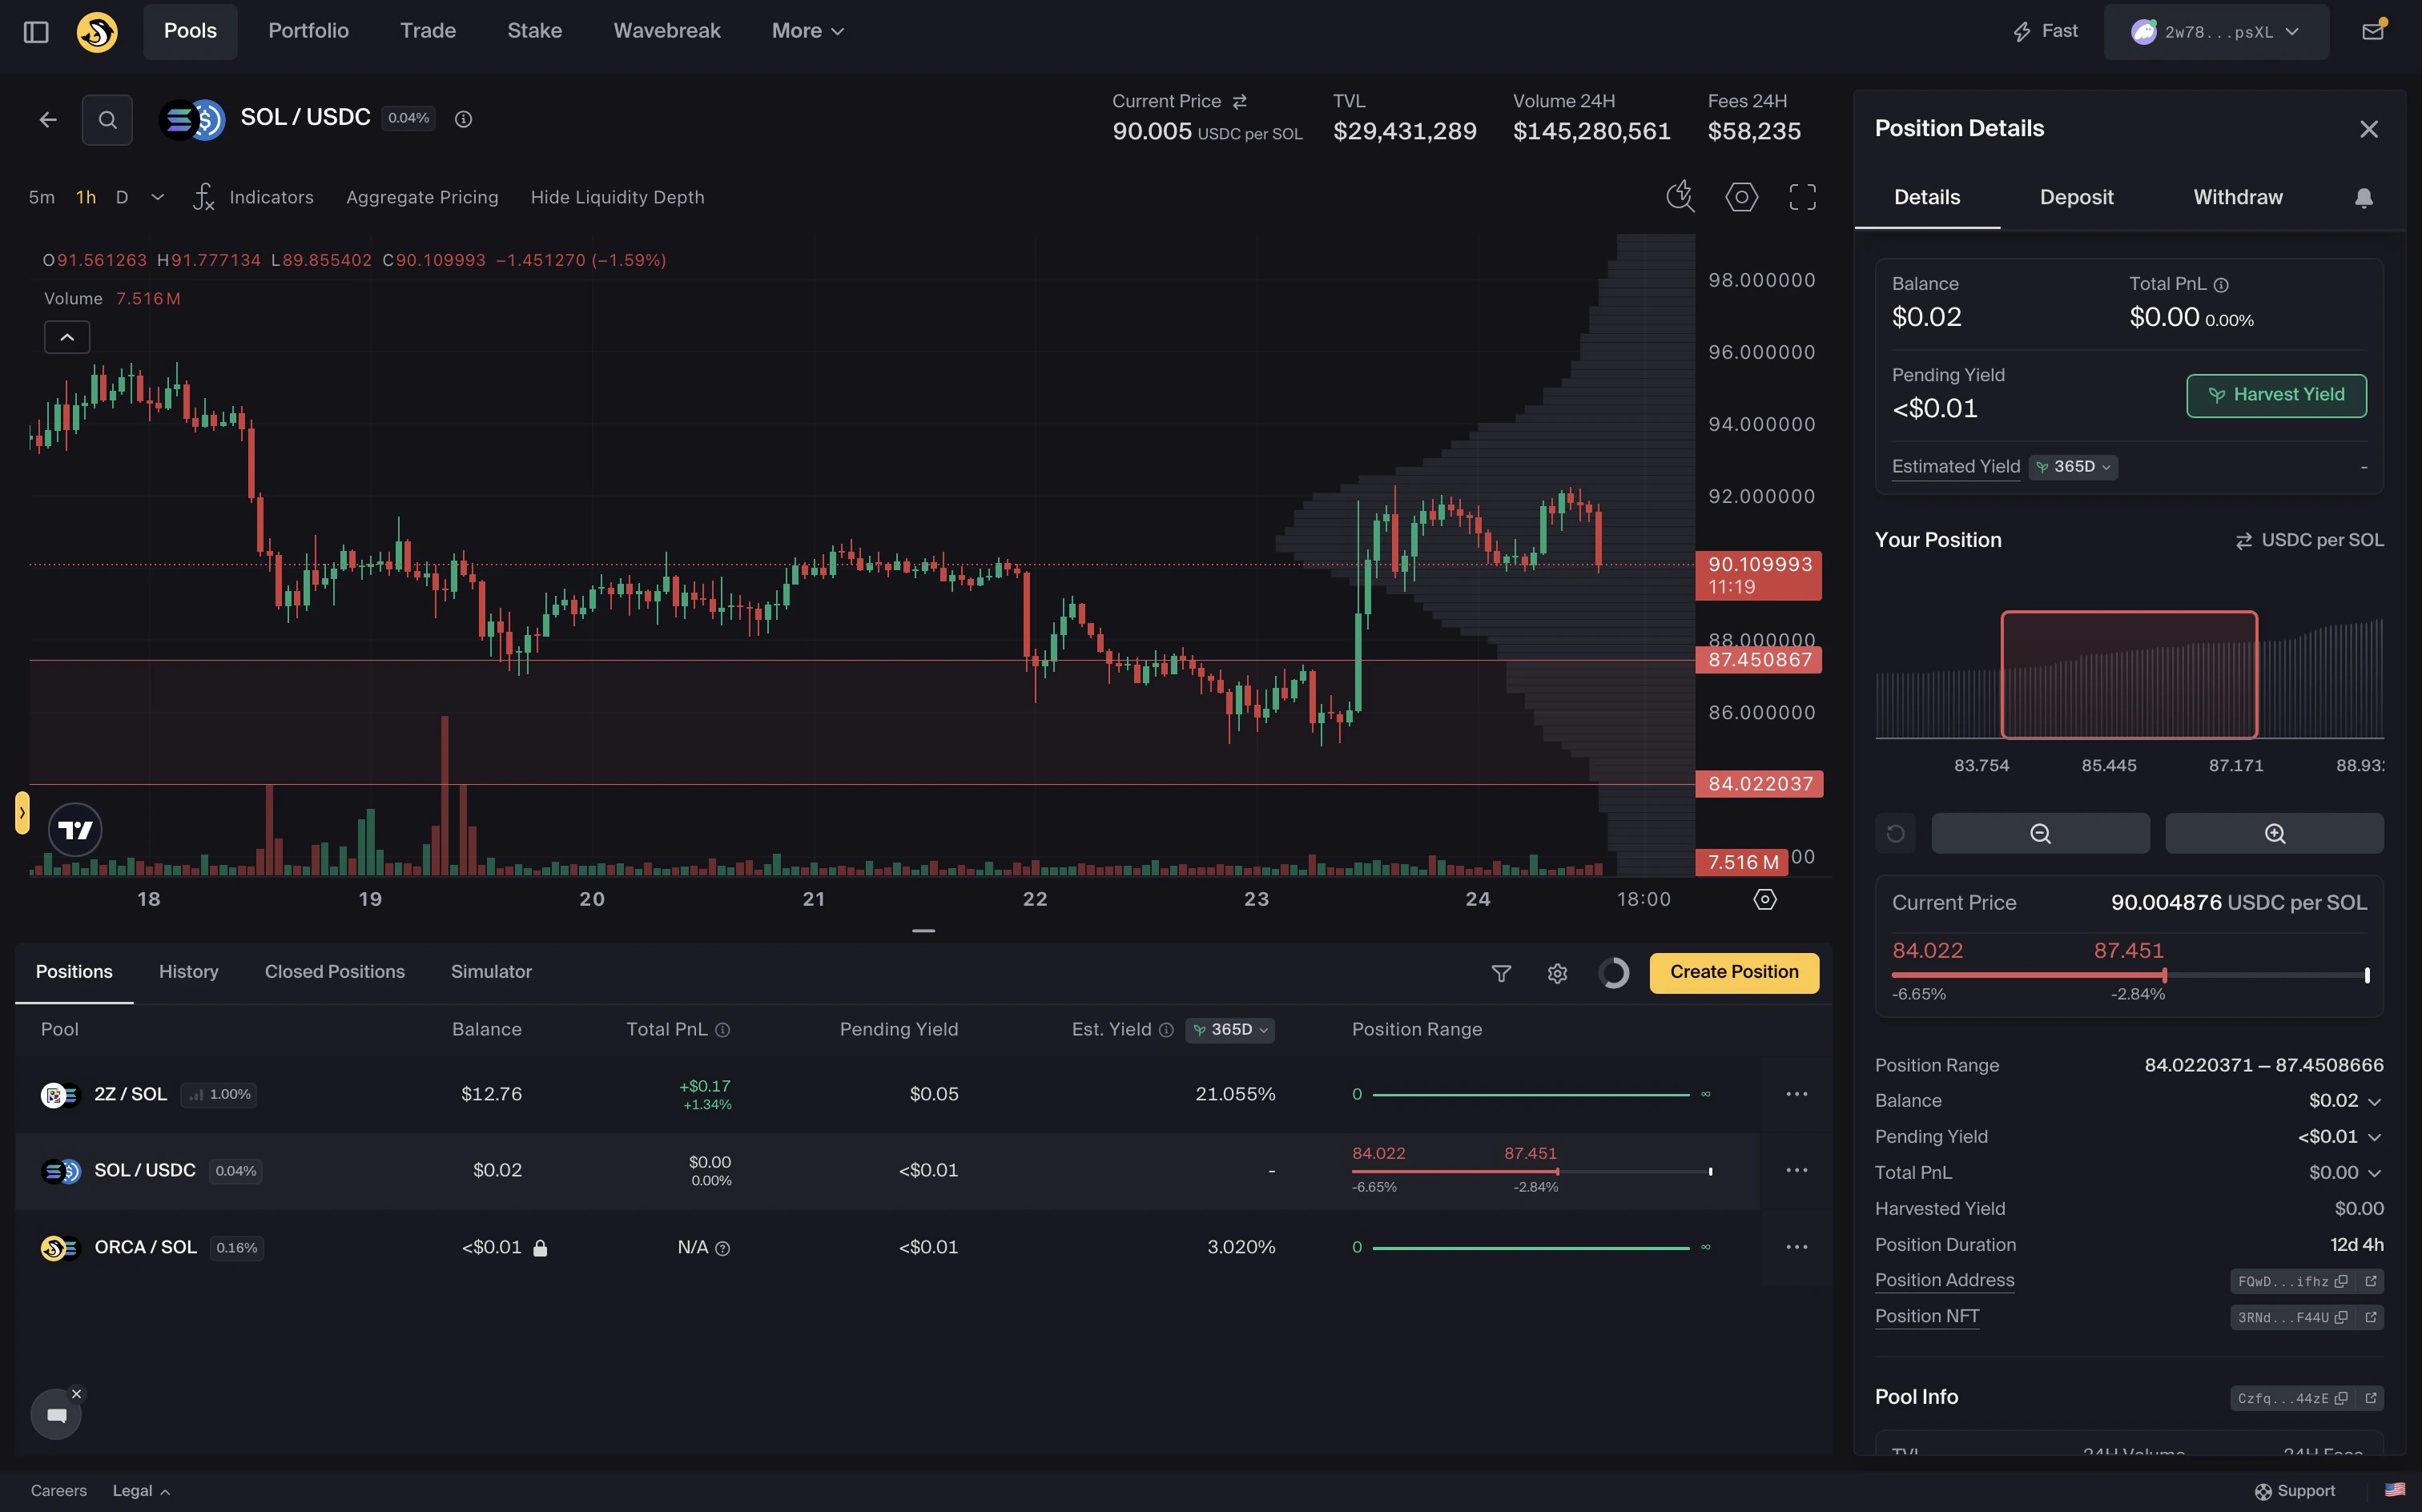
Bottom-Pane Tabs
Below the chart, four tabs let you switch context without leaving the terminal:- Positions — Your active positions in this pool
- History — Your transaction history for this pool
- Closed Positions — Positions you previously closed in this pool
- Simulator — Review estimated position outcomes using selected assumptions and available data. See Position Simulator
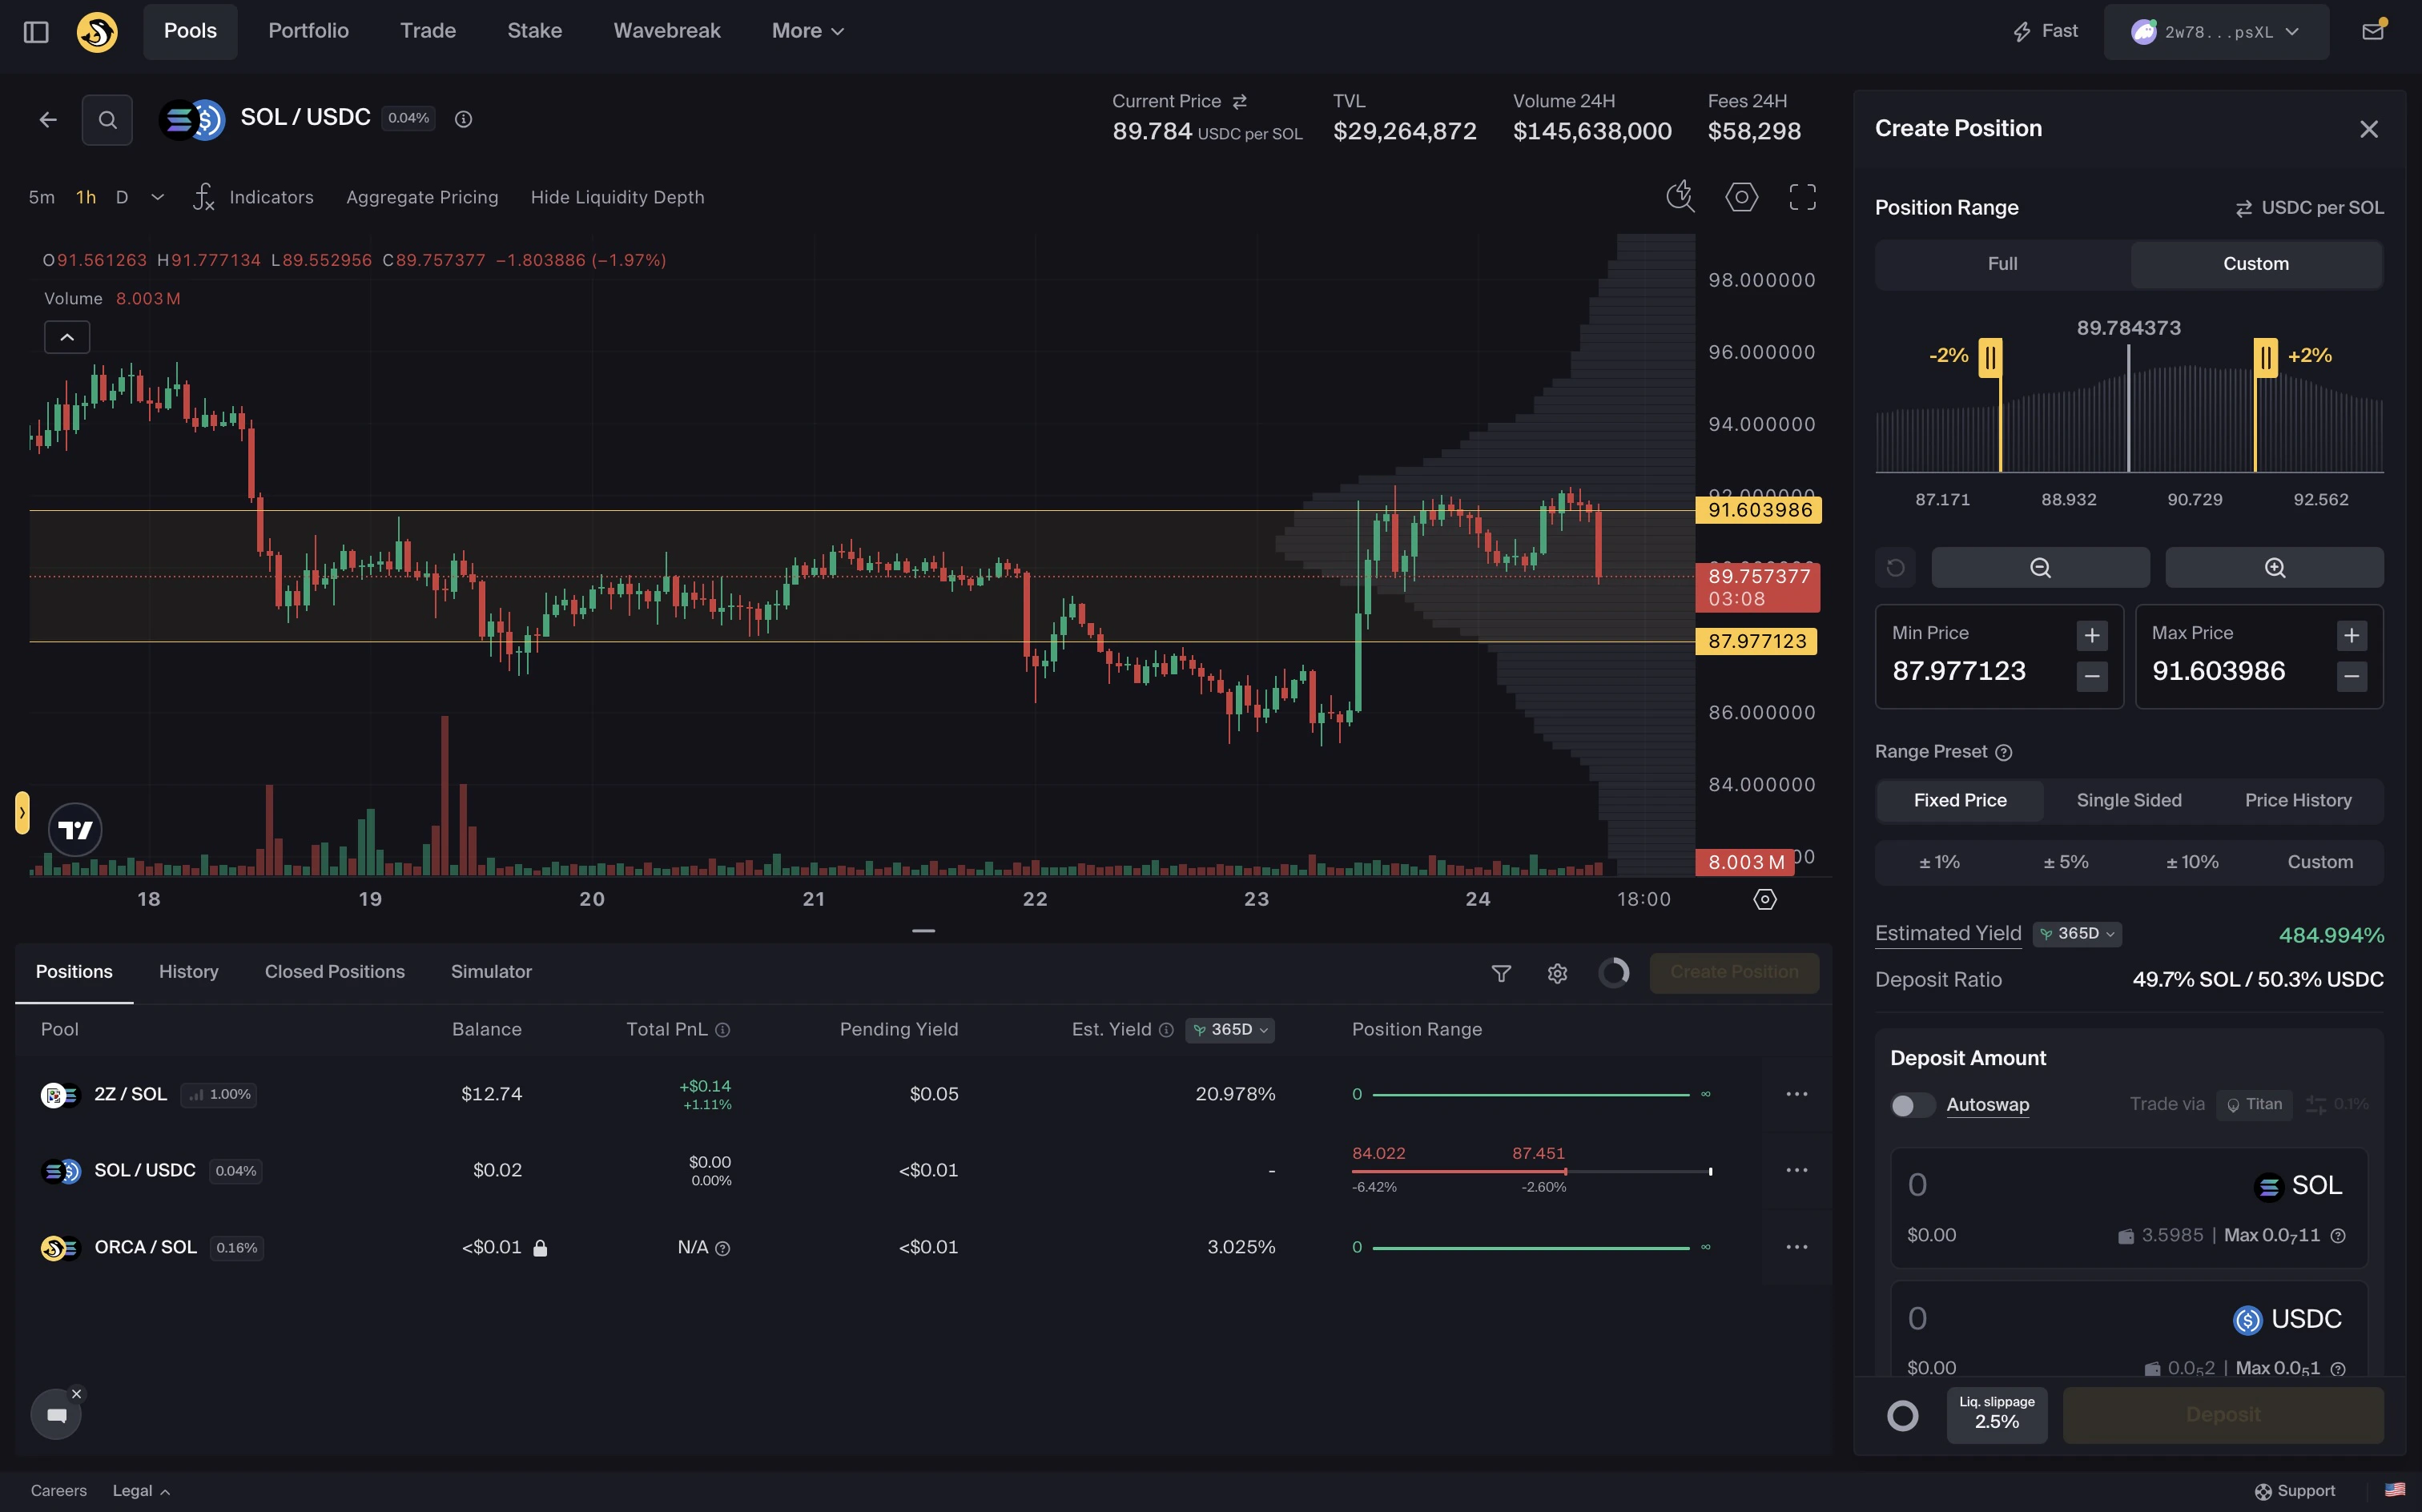
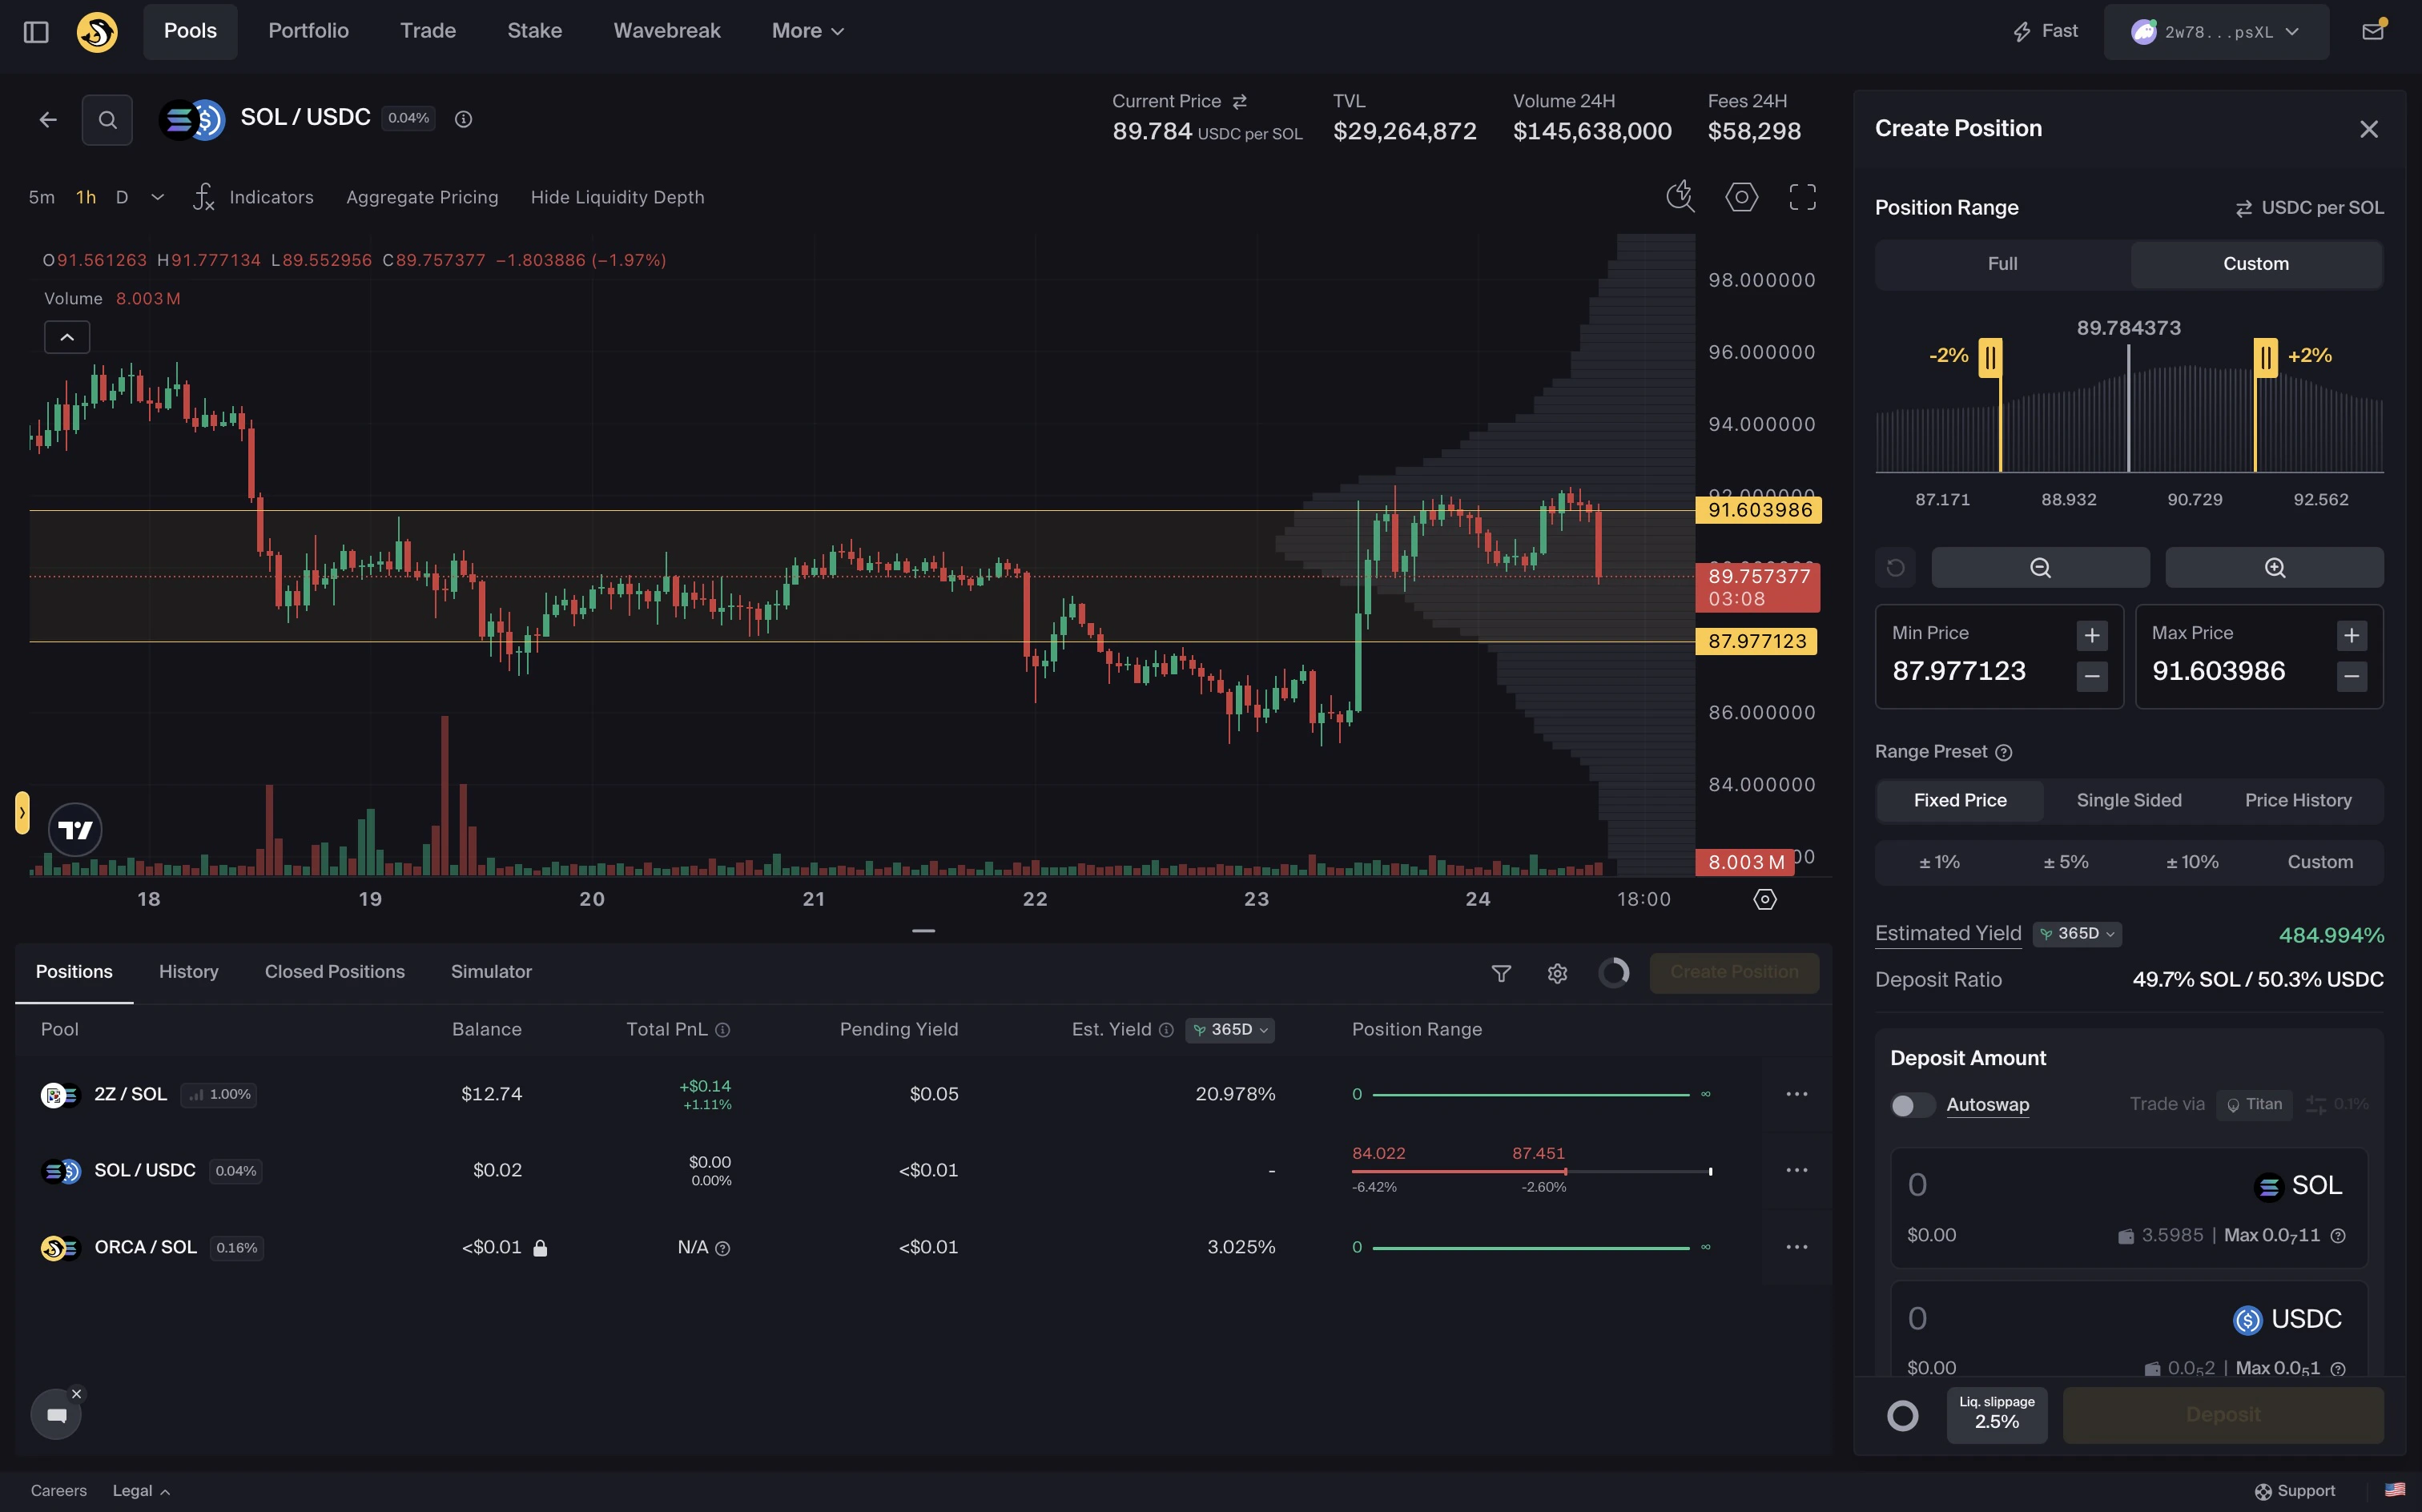
Create Position Sidebar
Use this sidebar to create a new position. The panel shows a Full / Custom range toggle, the current required asset ratio for the chosen range, and a range slider with quick−10% / +10% snap buttons.
For full steps, see:
Position Details Sidebar
When you click an existing position, the right-hand sidebar switches into Position Details mode. This includes Details, Deposit, and Withdraw tabs, plus a bell icon for alerts. The chart may also switch to the selected pair. For the full sidebar layout, see the Position Details Sidebar Guide. You can restore the Create Position sidebar by clicking Create Position in the bottom tab strip.Support and feedback
Need support or want to share feedback?- Open a support ticket directly from the Orca UI by clicking
Support - Reach out on Discord or Telegram