
The Position Simulator is an informational tool. It does not provide financial advice, predict future results, or guarantee any outcome. Simulated results are based on assumptions, current data, and historical data, and actual results may differ.
Why use the Position Simulator?
Concentrated liquidity positions can change as price moves through, into, or out of your selected range. The Position Simulator helps you review:- Estimated position value — See how position value may change at different selected prices
- Estimated token mix — Review how the position may shift between the two pool tokens
- Impermanent loss — Review estimated opportunity cost compared with holding the deposited tokens
- LP vs HODL — Compare estimated LP outcomes against holding at the selected price
- Range settings — Test different price ranges before creating a position
Getting Started
1
Navigate to a pool
Go to the Pools page and select a pool you want to review.
2
Set position parameters
In the Create Position sidebar, set your price range and optionally enter a deposit amount.
3
Open the Position Simulator
Find the Position Simulator directly below the Liquidity Terminal chart. Click to expand it.
4
Set the selected price
Click or drag the chart marker to set a Selected price. This is the price used to estimate position outcomes.
5
Configure time and yield settings
Enter Time In-Range and select a yield timeframe, such as 24H, to populate fee-based metrics.
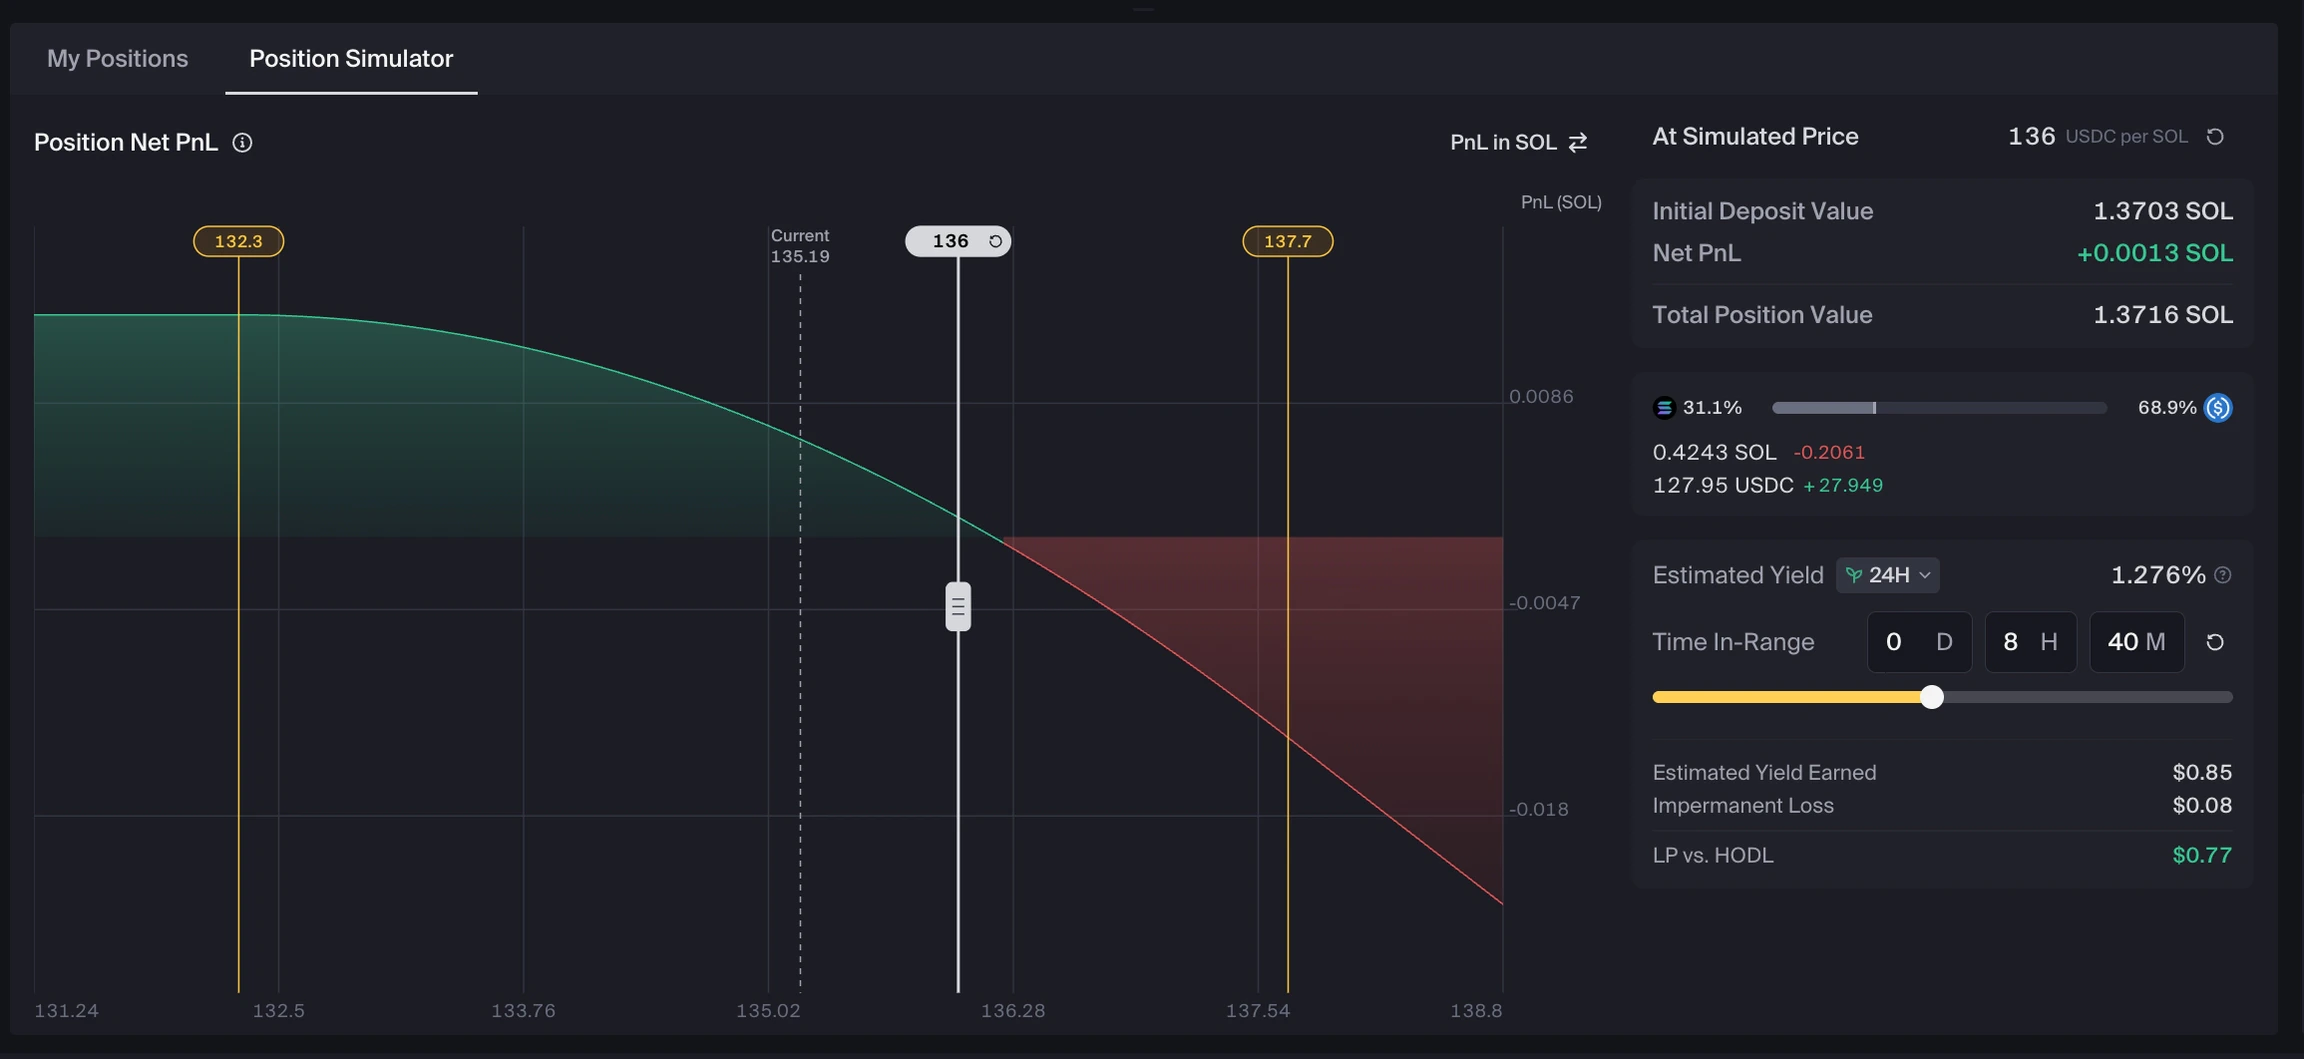
The Position Simulator interface showing estimated outcomes across different prices
Understanding the chart
The chart shows how estimated position outcomes change across different selected prices.Selected price vs current price
Current Price
The current pool price. This is shown as a gray dashed line on the chart for reference.
Selected Price
A price you choose for the simulation. Metrics update as you adjust this value.
Denomination toggles
The denomination toggles change how values are displayed:- Price denomination affects the x-axis and may flip the curve
- PnL denomination affects the y-axis and may invert values
If the chart flips after toggling tokens, this is expected behavior. Price denomination and PnL denomination can invert the displayed curve.
Key metrics explained
Net PnL
Net PnL
Estimated profit or loss at the selected price, relative to the deposit value.This may include:
- Token mix changes
- Estimated fees and rewards
- The selected currency denomination
Token Mix
Token Mix
Shows how the liquidity position may be split between the two pool tokens at the selected price.In concentrated liquidity pools, position composition changes as price moves:
- As price increases, the position may hold more of one token
- As price decreases, the position may hold more of the other token
- When price moves outside the selected range, the position may become 100% one-sided
Estimated Yield
Estimated Yield
Estimated fee return rate based on historical data and projected fee metrics for the selected timeframe, such as 1H, 24H, or 7D. Shown as a percentage of deposit value.Note: This metric is not annualized in the simulator.
Estimated Yield Earned
Estimated Yield Earned
Estimated fees earned over the entered Time In-Range.
- Only populates when a Time In-Range is entered
- Displayed in dollars when deposit amounts are entered
- Based on historical and current data, not guaranteed future fees
Time In-Range
Time In-Range
The total time you want to model the position as remaining within its selected price range.Important: Time In-Range represents modeled time within range, not total elapsed time.
LP Opportunity Cost
LP Opportunity Cost
The estimated cost of providing liquidity compared with holding the deposited assets at the selected price.It combines two sources of potential difference:
- Impermanent Loss — Occurs as price moves away from the deposit price while the position remains in range
- Directional Price Exposure — Occurs when a position moves out of range and becomes fully one-sided
Impermanent Loss (IL)
Impermanent Loss (IL)
The estimated opportunity cost of providing liquidity compared with holding the deposited tokens at the selected price. IL depends on price movement, not time.
- Shown as zero when the selected price matches the entry price
- Shown as a loss when price moves away from the entry price
LP vs HODL
LP vs HODL
The estimated difference between providing liquidity and holding the deposited tokens at the selected price.Formula:
Estimated Yield Earned − LP Opportunity Cost- Positive: The simulated LP outcome is higher than holding
- Negative: The simulated holding outcome is higher than LPing
- Shows as a percentage without a deposit amount
- Shows in dollars when a deposit amount is entered
- Only populates when Time In-Range is greater than 0
Common Questions
Why does LP Opportunity Cost show when Time In-Range is 0?
Why does LP Opportunity Cost show when Time In-Range is 0?
This is expected. LP Opportunity Cost is price-based, not time-based. It reflects the estimated opportunity cost at the selected price regardless of modeled time in range.
Why do I see '–' or '<0.01' in the metrics?
Why do I see '–' or '<0.01' in the metrics?
This usually means:
- Time In-Range is 0, and/or
- No deposit amount has been entered
Why is my token mix showing 100% one token?
Why is my token mix showing 100% one token?
This means the selected price is outside the selected range. Out-of-range positions:
- Do not accrue swap fees while out of range
- Become fully one-sided in token composition
Why is LP vs HODL negative even though Estimated Yield is positive?
Why is LP vs HODL negative even though Estimated Yield is positive?
Estimated yield can be lower than estimated impermanent loss or LP opportunity cost at the selected price. In that simulation, holding shows a higher estimated outcome than providing liquidity.
Why does the simulator not match actual results?
Why does the simulator not match actual results?
The simulator provides estimates based on current data, historical data, and selected assumptions. Actual results depend on factors including:
- Future trading volume and fees
- Future price movement
- Liquidity changes
- Reward availability
- Market conditions
- Time actually spent in range
Data Sources
The Position Simulator uses onchain pool data and historical trading activity from Orca to estimate outcomes.Limitations
The simulator uses estimates and assumptions. Keep in mind:- Slippage and priority fees are not accounted for
- Earned fees are estimated, not guaranteed
- Rewards may change or may not be available
- Market conditions may change rapidly
- Actual time in range may differ from the selected Time In-Range
- Actual results may differ significantly from simulations
Video Walkthrough
Watch a demonstration of the Position Simulator:Next Steps
Impermanent Loss
Learn how impermanent loss works in concentrated liquidity
Create a Custom Range Position
Learn how to set a custom range
Liquidity Position Concepts
Review key concepts for liquidity positions
Understanding Charts
Learn how to read price charts and liquidity distribution