
TL;DR: APR is an estimate based on recent fee income — it is not your actual or guaranteed return. Your real return is fee income minus divergence loss. A high-APR pool can still underperform a simple hold if the price trends strongly in one direction.
The two forces that determine your return
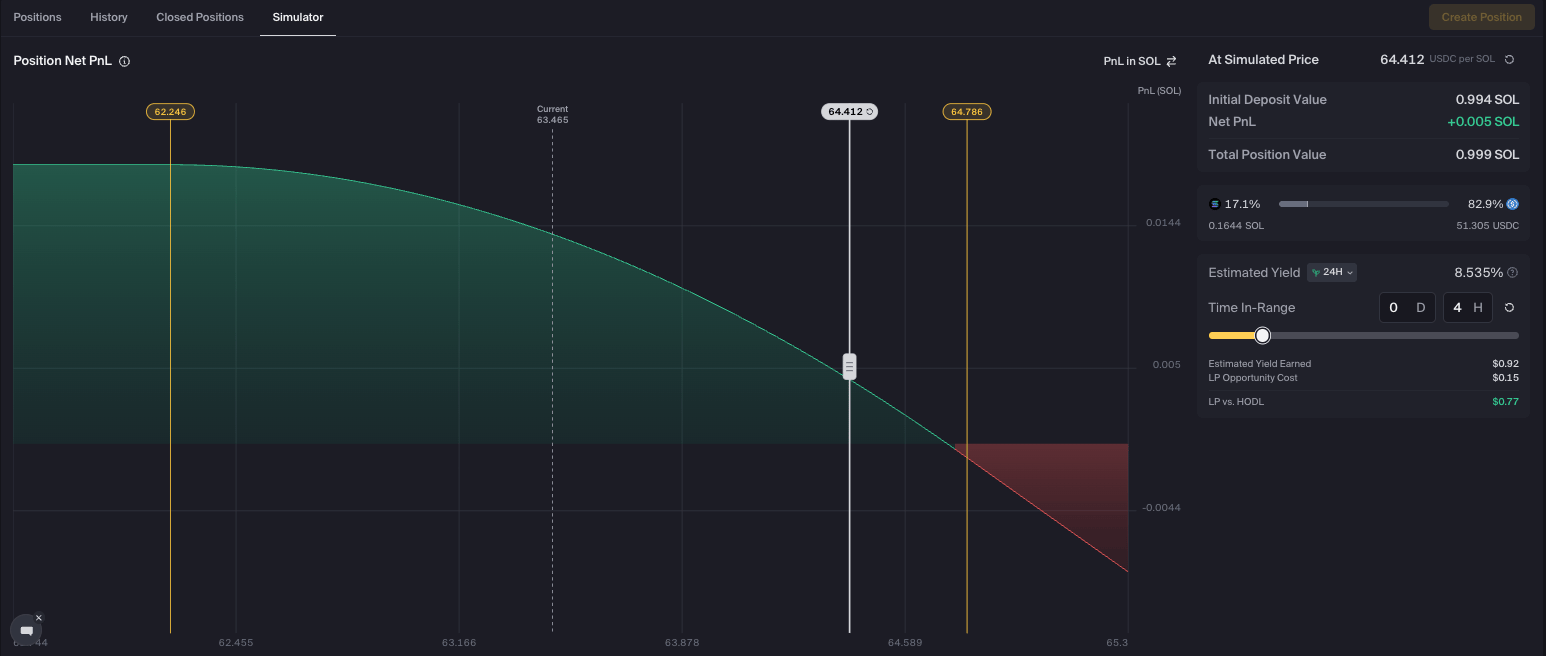
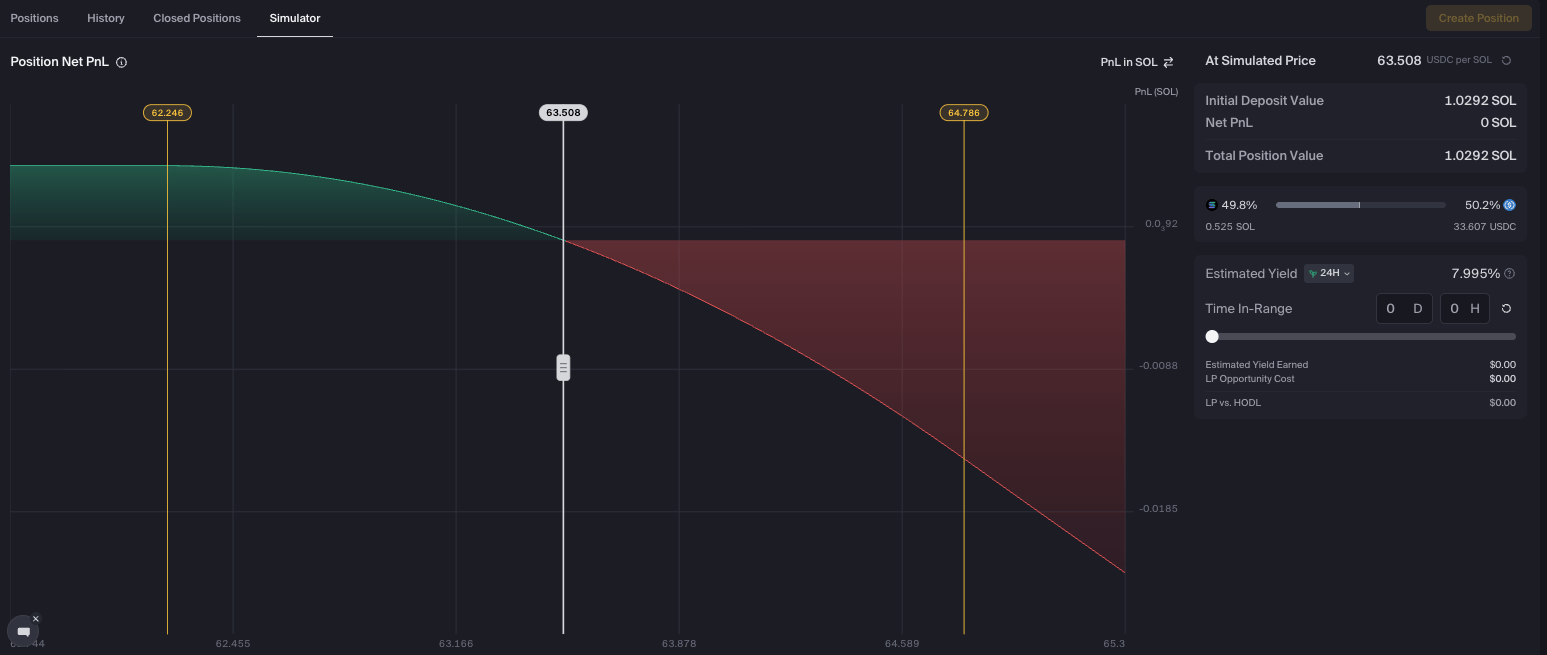
Fee income is straightforward. Every time a trader swaps through your pool, they pay a fee. You earn a share proportional to how much of the pool’s active liquidity your position represents. Fee income accumulates continuously and can be harvested at any time. Divergence loss (also called impermanent loss) is subtler. It’s the gap between what your position is worth and what it would have been worth if you’d simply held the same tokens without LPing. It’s not a fee you pay — it’s an opportunity cost that emerges from the way concentrated liquidity mechanics work. Your net return is fee income minus divergence loss. If fees > divergence loss, you’re ahead of just holding. If divergence loss > fees, you would have done better holding.How divergence loss actually works — with numbers
Suppose you deposit SOL and USDC into a pool with SOL at $100. You deposit 1 SOL and 100 USDC, for a total of $200. If SOL rises to $150, the pool’s rebalancing mechanism means you now hold less SOL and more USDC. Your position is worth roughly $245 — but if you’d just held 1 SOL and 100 USDC, you’d have $250. The $5 gap is divergence loss. If SOL falls to $67, your position is worth roughly $165 — but holding would have given you $167. Again, the LP position slightly underperforms holding. The key pattern: divergence loss increases with price movement in either direction. The further the price moves from where you entered, the larger the gap between your LP position and a simple hold. In concentrated liquidity (CLMM) pools, this effect is amplified. Concentrating your liquidity into a narrower range means you earn more fees when the price is in range — but you also experience larger divergence loss for the same price movement, because your capital is deployed more aggressively.What does LP APR mean?
The APR shown on a pool reflects recent fee income annualized. It tells you: if the pool had exactly the same volume for a full year, and your position stayed fully in range, this is what you’d earn in fees. What it doesn’t account for:- Divergence loss. APR is a fee-only number. It doesn’t subtract the opportunity cost of price movement.
- Out-of-range time. If the price moves outside your range, your position earns zero fees for that period. APR assumes you’re always in range.
- Volume changes. Trading volume varies. A high-APR period may not continue.
LP returns vs holding: when fee income wins
Impermanent loss vs fees: when divergence loss wins
How to evaluate your position
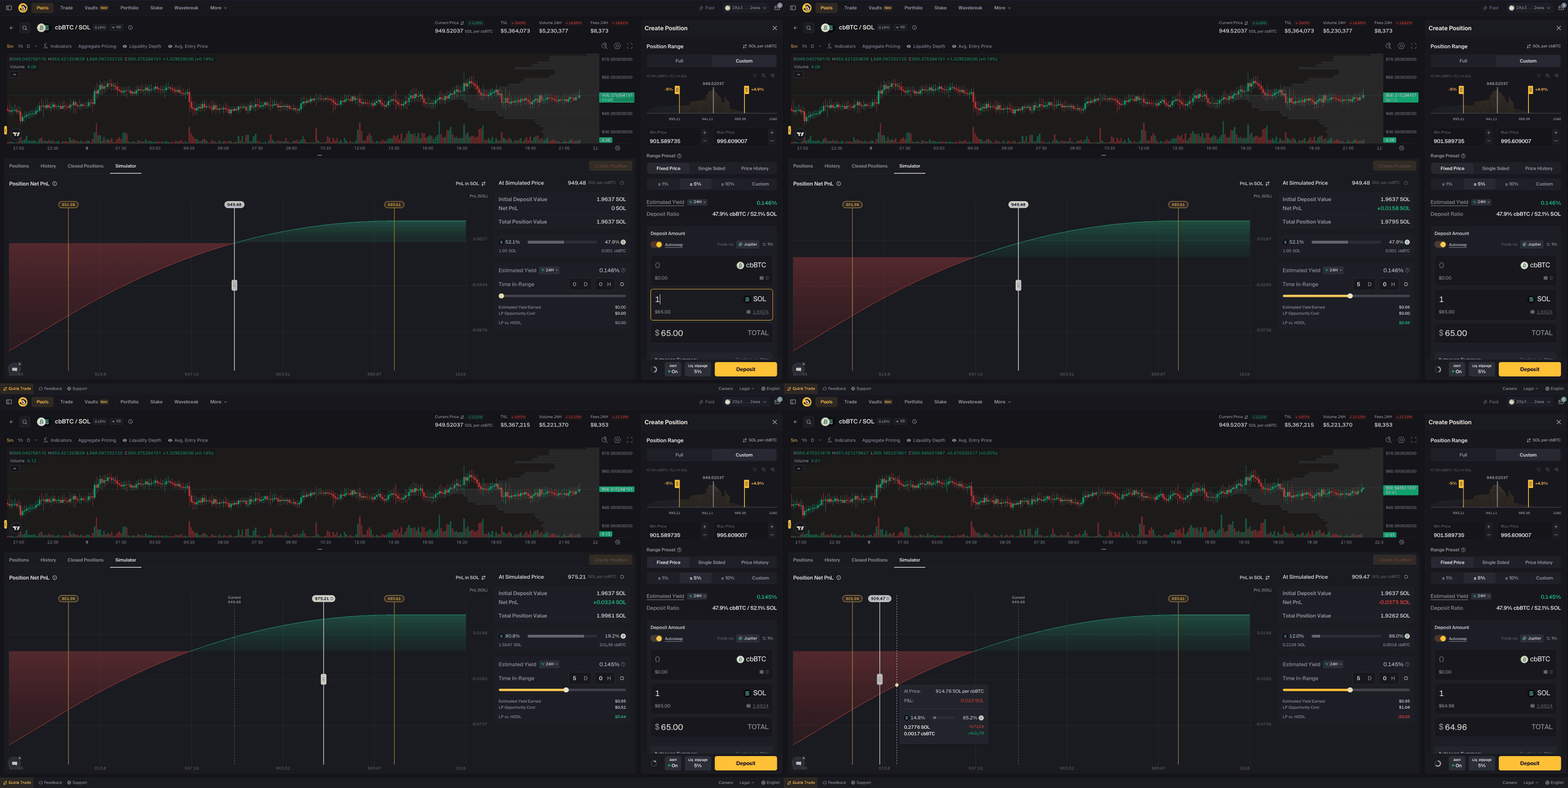
Rather than checking your position value against what you deposited, compare it to what you would have had if you’d just held the tokens. This is the only comparison that tells you whether LP is paying off. If your fees earned exceed the divergence loss on your position, LP has been profitable relative to holding. If not, you would have done better just holding. You can use the LP simulator before entering a position to model how fee income and divergence loss interact at different price scenarios for a given range. After opening a position, the position history and portfolio dashboard show your fees earned, current position value, and overall performance over time.Practical implications for range selection
The range you choose directly affects both sides of this equation:- Tighter range → higher fee income when in range, higher divergence loss per unit of price movement, higher chance of going out of range
- Wider range → lower fee income, lower divergence loss, stays in range longer
Ready to put this into practice? Browse pools on Orca to find pairs with consistent volume and fee income that fit your strategy.
Related
Divergence loss explained
Deeper explanation of how divergence loss is calculated.
LP simulator
Model your returns before opening a position.
Reading your portfolio
How to interpret your portfolio dashboard metrics.
Advanced strategies
Range selection and active management.